Save and load results as HDF5 files
[1]:
import pypesto
import numpy as np
import scipy as sp
import pypesto.optimize as optimize
import matplotlib.pyplot as plt
import pypesto.store as store
import tempfile

%matplotlib inline
This notebook we will demonstrate, how to save and (re-)load optimization results and traces to a .hdf5 file. The use case of this notebook is to generate visulaizations from reloaded optimization results and traces.
Define the objective and problem
[2]:
objective = pypesto.Objective(fun=sp.optimize.rosen,
                              grad=sp.optimize.rosen_der,
                              hess=sp.optimize.rosen_hess)

dim_full = 20
lb = -5 * np.ones((dim_full, 1))
ub = 5 * np.ones((dim_full, 1))

problem = pypesto.Problem(objective=objective, lb=lb, ub=ub)
Define history options and run optimization
[21]:
# create optimizers
optimizer = optimize.ScipyOptimizer()

# set number of starts
n_starts = 10

# save optimizer trace (to temporary file fn)
fn = tempfile.mktemp(".hdf5")
history_options = pypesto.HistoryOptions(trace_record=True, storage_file=fn)

# Run optimizaitons
result = optimize.minimize(
    problem=problem, optimizer=optimizer,
    n_starts=n_starts, history_options=history_options)
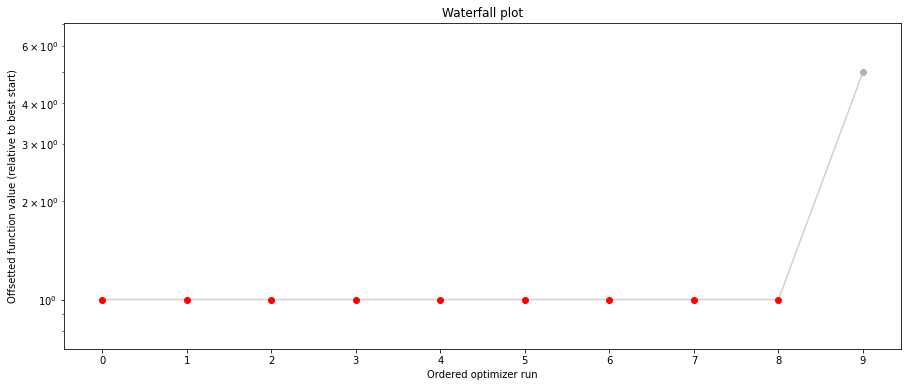
Plot result
We now want to plot the results (before saving).
[22]:
import pypesto.visualize

# plot waterfalls
pypesto.visualize.waterfall(result, size=(15,6))
[22]:
<matplotlib.axes._subplots.AxesSubplot at 0x7fa5266cf880>

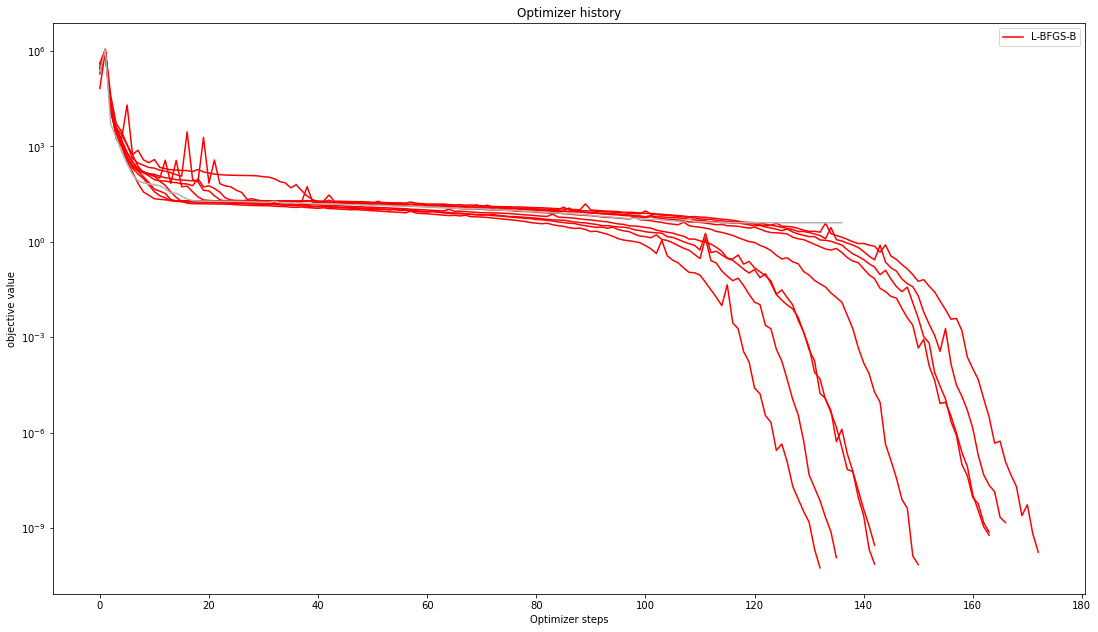
Plot trace
[23]:
pypesto.visualize.optimizer_history(result,
                                    legends=['L-BFGS-B'])
[23]:
<matplotlib.axes._subplots.AxesSubplot at 0x7fa5263af430>
Save optimization result as HDF5 file
[24]:
# name of the (in this case temporary) file
# fn = tempfile.mktemp(".hdf5")

# Write result
hdf5_writer = store.OptimizationResultHDF5Writer(fn)
hdf5_writer.write(result, overwrite=True)

# Write problem
hdf5_writer = store.ProblemHDF5Writer(fn)
hdf5_writer.write(problem)
Reload results
[25]:
# Read result and problem
hdf5_reader = store.OptimizationResultHDF5Reader(fn)
result2 = hdf5_reader.read()
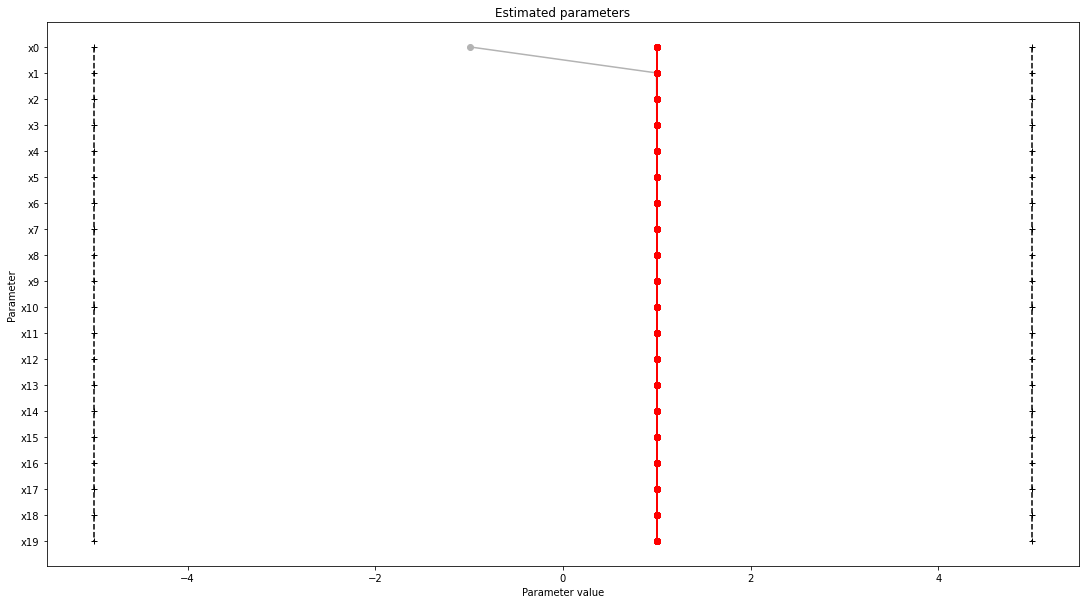
Plot (reloaded) results
[26]:
# plot waterfalls
pypesto.visualize.waterfall(result2, size=(15,6))
[26]:
<matplotlib.axes._subplots.AxesSubplot at 0x7fa5262e9ca0>
[27]:
pypesto.visualize.parameters(result2,
                            balance_alpha=False)
[27]:
<matplotlib.axes._subplots.AxesSubplot at 0x7fa5262a1280>
Plot (reloaded) traces
[30]:
pypesto.visualize.optimizer_history(result2,
                                    legends=['L-BFGS-B'])
[30]:
<matplotlib.axes._subplots.AxesSubplot at 0x7fa5260d1a00>

[ ]: